


TL;DR
Nelson Rules and Western Electric Rules are methods used in Statistical Process Control (SPC) to detect abnormal variation in manufacturing processes. When applied through MES platforms like TrakSYS, these rules help teams identify deviations earlier and respond quickly to maintain quality and process stability.
Key takeaways:
- SPC monitors process variation using control charts to distinguish normal vs. abnormal behavior.
- Western Electric Rules detect basic deviations such as points outside standard control limits.
- Nelson Rules expand detection methods by identifying trends, oscillations, and subtle shifts.
- MES platforms like TrakSYS automate SPC monitoring, triggering alerts when rule violations occur.
A Look at the Rules and Standards that Shape Statistical Process Control
SPC: An Overview
Let’s Dive right in. Statistical Process Control (SPC) is a methodology that leverages statistics—as the name implies—to monitor and control the quality of production processes. By systematically analyzing variation, SPC enables manufacturers to enhance efficiency, minimize waste, and maintain high-quality output. Foundational to SPC is its ability to distinguish between common cause (natural) and special cause (unanticipated) variation: a discernment that helps enable predictive maintenance and preemptive issue resolution.
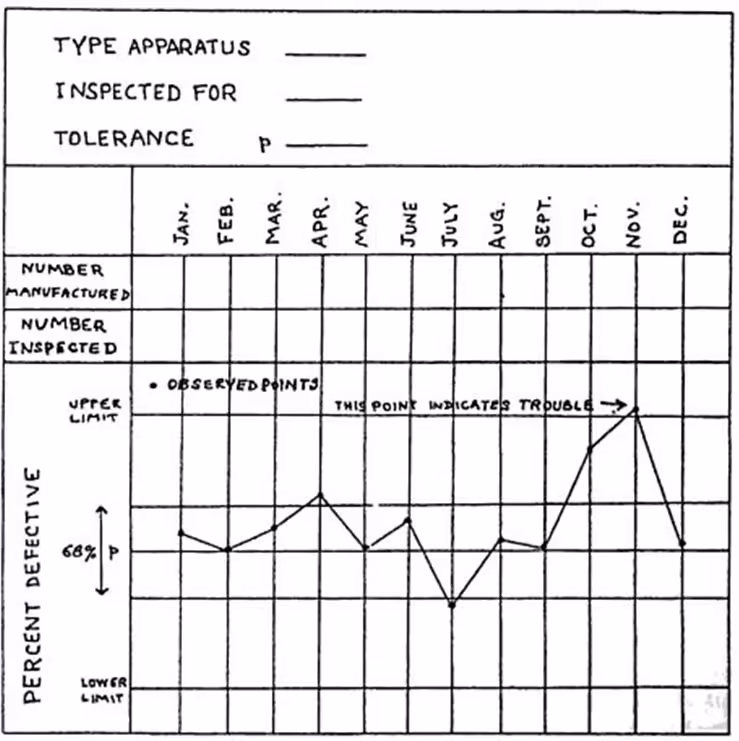
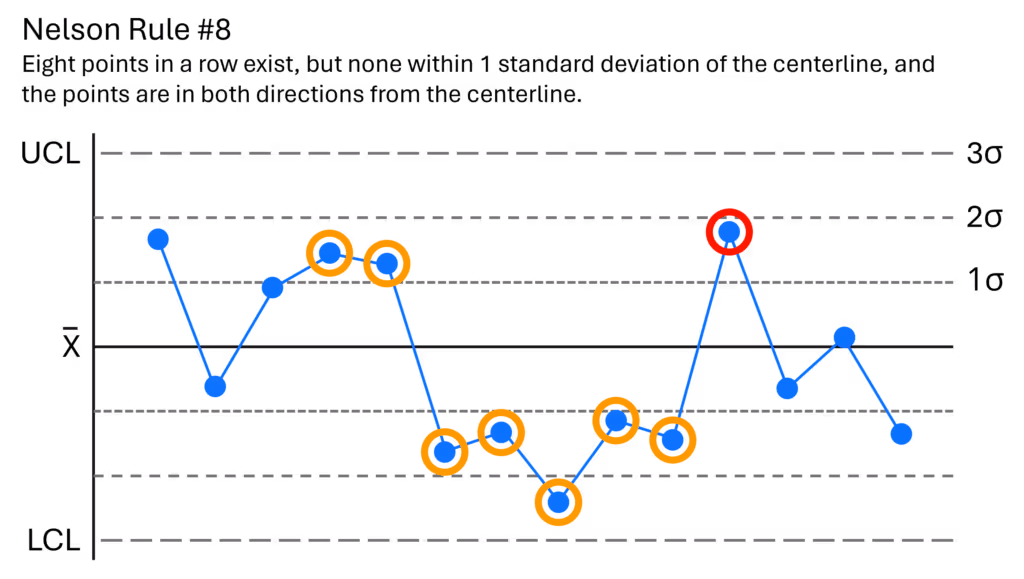
When it comes to how SPC is visually represented, control charts (dynamic line charts) serve as the cornerstone of the methodology. These charts delineate a centerline (indicating the mean) and upper and lower control limits, facilitating the identification of deviations from expected norms. As far as abnormality detection is concerned, specific methods (rules), such as Nelson Rules and Western Electric Rules, are employed and serve as diagnostic tools for process health.
Control Charts: A History
The genesis of control charts dates back to the pioneering work of Walter A. Shewhart at Bell Labs in the 1920s. Shewhart's contributions laid the foundation for distinguishing between common and special causes of variation. Subsequent refinement by engineers like Bonnie Small (who created over 5000 control charts!) at Western Electric further solidified the methodology's efficacy. Today, control charts remain indispensable for maintaining process stability and optimizing performance.
Detecting Deviation: The Rules That Guide
When it comes to how SPC is configured to search for and identify process variations, there are two standards of rules—Nelson and Western Electric—that are typically employed. While Nelson Rules expand upon the original Western Electric Rules, both serve similar functions. From identifying points beyond standard deviations to detecting consecutive trends and oscillations, these rules provide a comprehensive framework for anomaly detection. When applied to control charts, violations of these rules serve as red flags, indicating potential issues within the manufacturing process. By visualizing these violations, manufacturers can proactively address underlying issues before they escalate, minimizing downtime and waste.
| Rule Category | Control Chart Example | Nelson Rule Description | Western Electric Rule Description | Problem Identified |
|---|---|---|---|---|
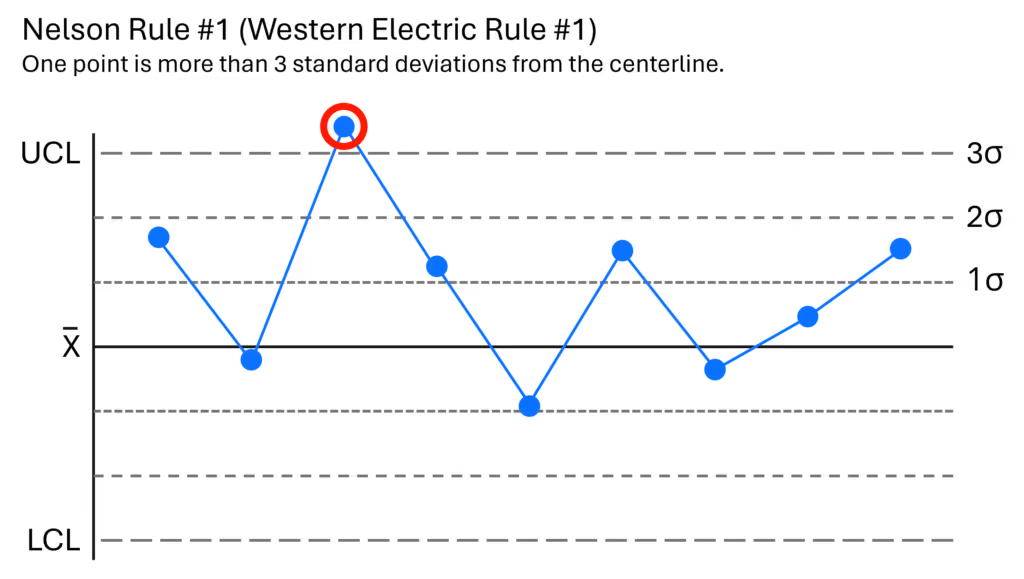
| Points beyond 3σ |
|
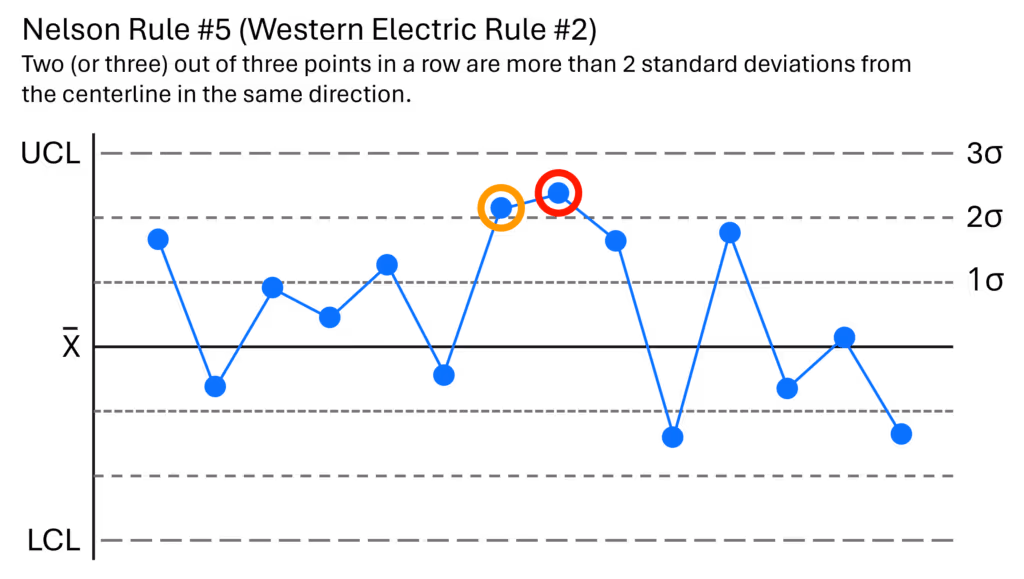
One point is more than 3 standard deviations from the centerline. (Rule 1) | One point is more than 3 standard deviations from the centerline. (Rule 1) | A sample is grossly out of control. |
| Points beyond 2σ |
|
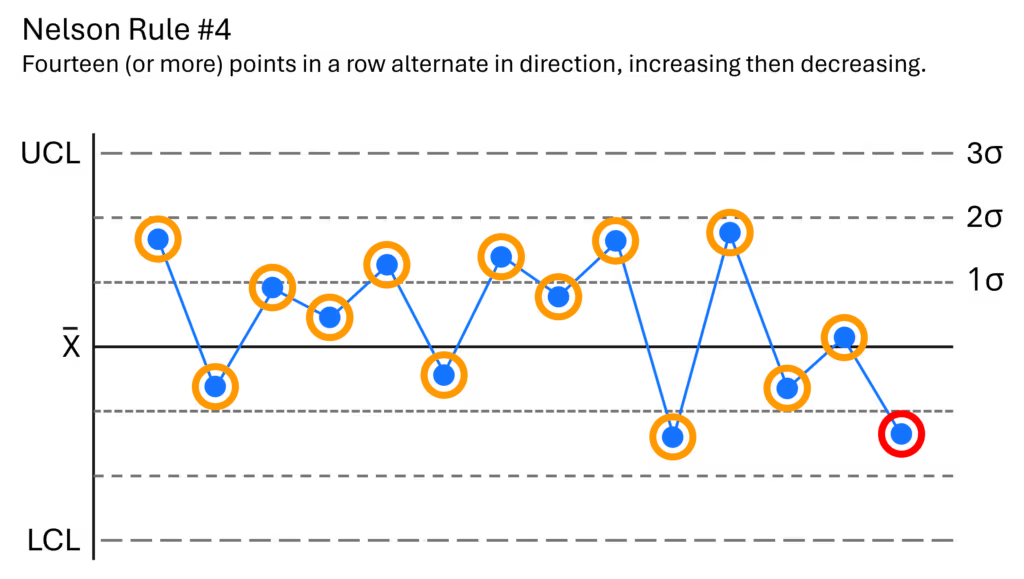
Two (or three) out of three points in a row are more than 2 standard deviations from the centerline in the same direction. (Rule 5) | Two out of three consecutive points are more than 2 standard deviations from the centerline (on the same side). (Rule 2) | There is a medium tendency for samples to be mediumly out of control. |
| Points beyond 1σ |
|
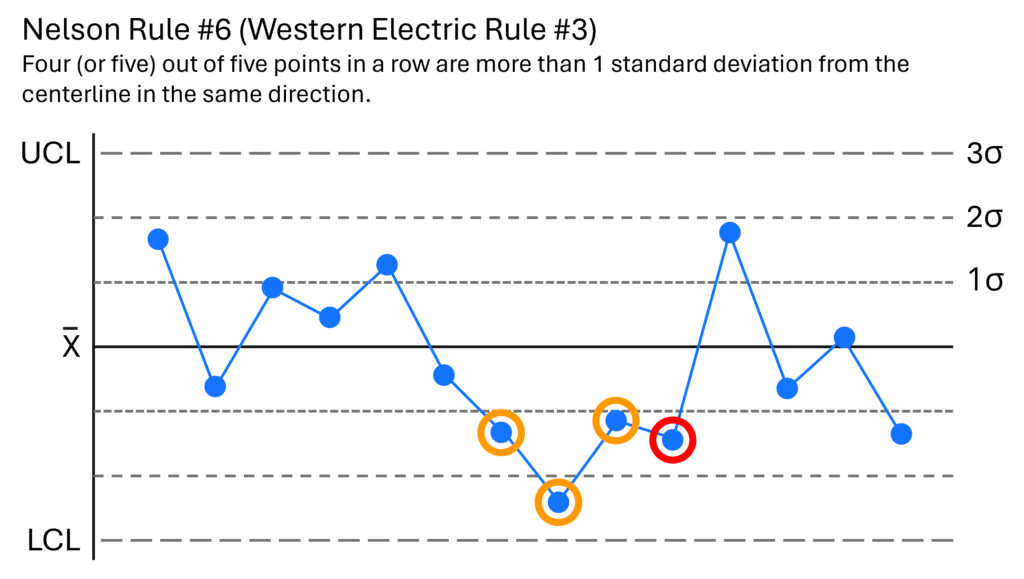
Four (or five) out of five points in a row are more than 1 standard deviation from the centerline in the same direction. (Rule 6) | Four out of five consecutive points are more than 1 standard deviation from the centerline (on the same side). (Rule 3) | There is a strong tendency for samples to be slightly out of control. |
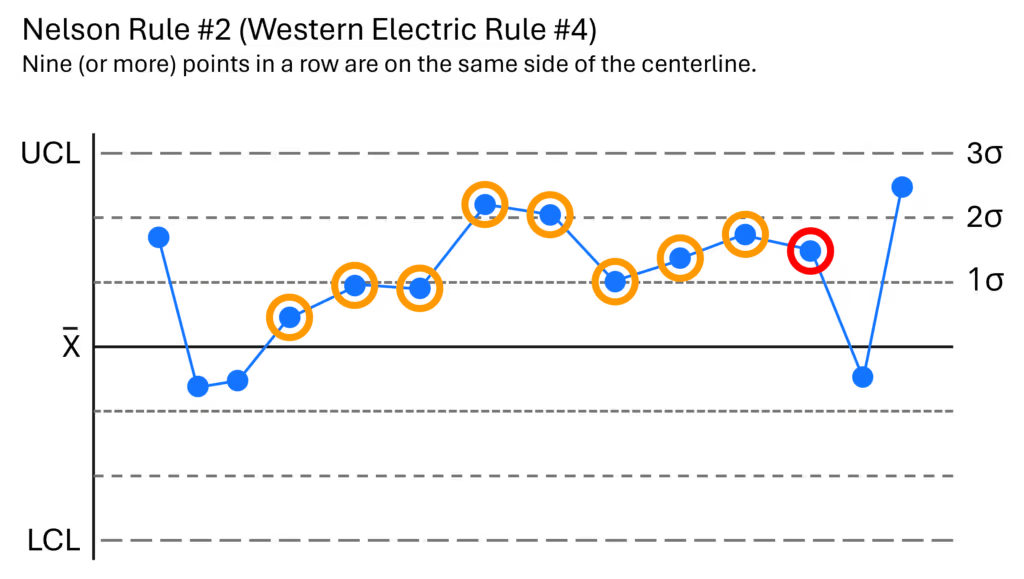
| Consecutive points on one side of the centerline |
|
Nine (or more) points in a row are on the same side of the centerline. (Rule 2) | Eight or more consecutive points are on the same side of the centerline. (Rule 4) | Some prolonged bias exists. |
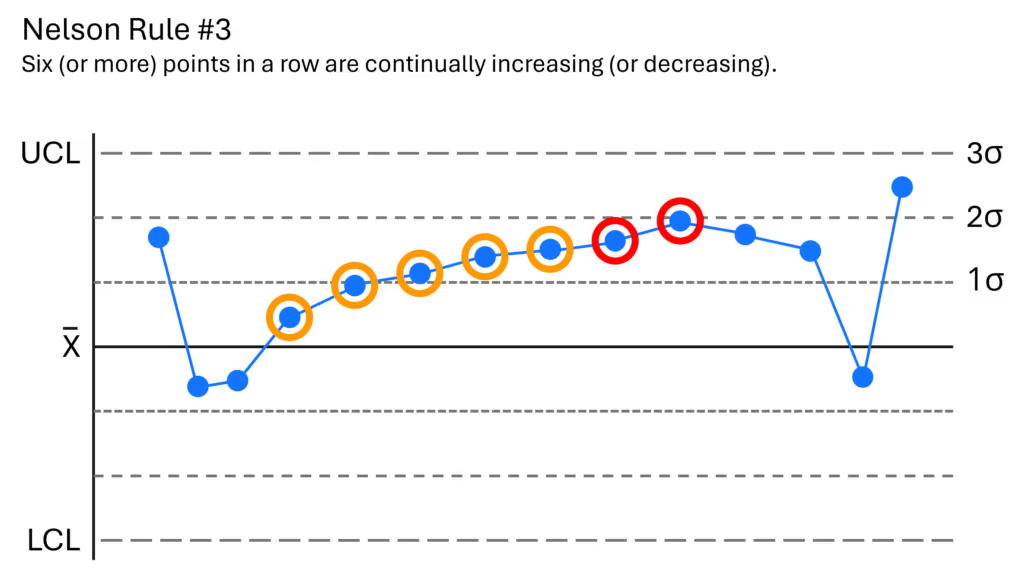
| Trending |
|
Six (or more) points in a row are continually increasing (or decreasing). (Rule 3) | NA | A trend exists. |
| Oscillation |
|
Fourteen (or more) points in a row alternate in direction, increasing then decreasing. (Rule 4) | NA | This much oscillation is beyond noise. |
| Reduced Variation |
|
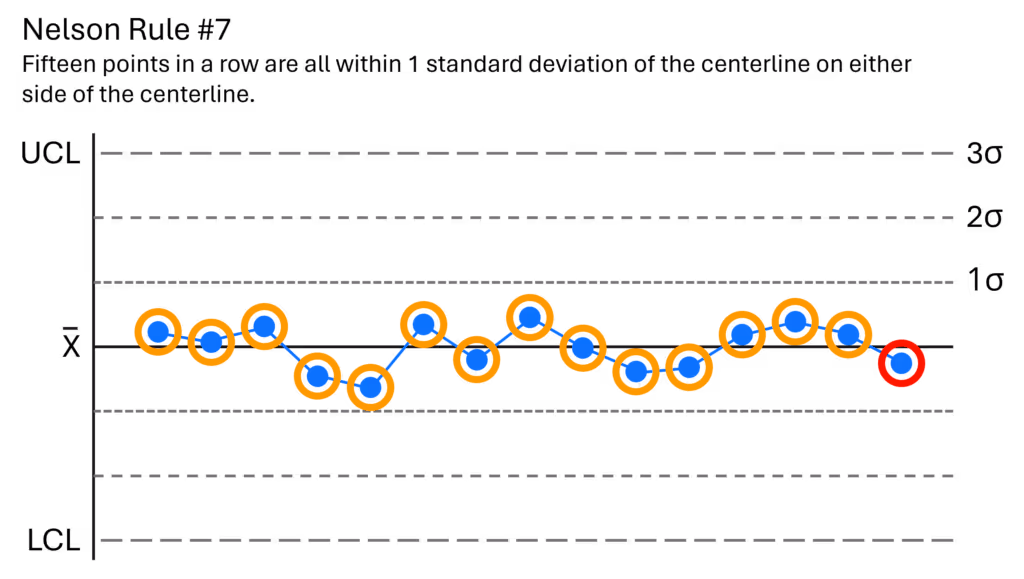
Fifteen points in a row are all within 1 standard deviation of the centerline on either side. (Rule 7) | NA | With 1 standard deviation, greater variation would be expected. |
| Increased Variation |
|
Eight points in a row exist, but none within 1 standard deviation of the mean, and points are in both directions. (Rule 8) | NA | Jumping from above to below while missing the first standard deviation band is rarely random. |
Strategies for Responding to Rule Indications:
When a special cause variation occurs, it indicates that something unusual has happened that is affecting the process. Here are some next steps to take:
Identify the Cause: The first step is to investigate and identify the specific cause of the variation. This may involve reviewing process documentation, interviewing personnel, examining equipment, or analyzing data. If a special cause source cannot be found, it will become common to the process. As time goes on, the special causes repeat and cease being special. They then increase the natural variation in the process.
Address the Cause: Once the cause has been identified, take appropriate action to address it. This might involve making adjustments to equipment or procedures, providing additional training to personnel, or implementing corrective actions to prevent recurrence.
Document the Action Taken: It's important to document the actions taken to address the special cause variation. This helps ensure that the response is consistent and provides a record for future reference.
Monitor the Process: After taking corrective action, continue to monitor the process to ensure that the special cause variation has been effectively addressed. This may involve ongoing data collection and analysis to verify that the process is stable and performing as expected.
Review and Learn: Finally, take the opportunity to review the incident and learn from it. Consider whether there are any systemic issues or underlying root causes that need to be addressed to prevent similar occurrences in the future. This may involve updating procedures, improving training programs, or implementing preventive measures.

MES and SPC: A Quality Pairing
When paired with a comprehensive manufacturing execution system (MES) platform like TrakSYS, SPC transforms manufacturing quality management. This partnership not only lends additional, pertinent operational context through which to view SPC data but also streamlines the alignment between internal performance benchmarks and customer quality expectations. Whether it be through direct integration with business systems and equipment or through the use of the versatile TrakSYS Smart Devices, when the platform is monitoring production, production team members will instantly be notified when something goes out of spec and will be able to quickly resolve the issue by leveraging the situational context TrakSYS provides.
So, with all of that said, you might be wondering What goes into TrakSYS-backed SPC. The methodology focuses on four key pillars: data collection, control charts, rule definitions, and notifications:
Data Collection
TrakSYS enables seamless data collection through various channels, including manual entry via online forms and automatic integration with existing quality systems and APIs. By aggregating data from disparate sources, TrakSYS provides a holistic view of process performance, enabling real-time monitoring and analysis.
Control Charts
While SPC analysis can be conducted without visual aids, control charts offer invaluable insights into process behavior over time. TrakSYS' intuitive interface allows users to effortlessly generate customizable control charts which visualize key quality metrics and help teams identify trends, outliers, and rule violations with ease.
Rule Definitions:
TrakSYS incorporates both Nelson and Western Electric Rules as standard options for rule violation detection. These rules, along with customizable scripts, enable manufacturers to tailor SPC analyses to their specific requirements, ensuring comprehensive coverage of potential quality issues.
Notifications:
TrakSYS' notification engine provides real-time alerts via email, in-browser messages, and webhooks, notifying the appropriate parties of rule violations and impending quality issues. By facilitating rapid response and intervention, TrakSYS minimizes the impact of deviations on production outcomes, ensuring seamless operations and customer satisfaction.
An Efficient Variation
In today's hyper-competitive landscape, SPC is a necessity for any business intent on ensuring operational excellence and maintaining a competitive edge. Harnessing the power of TrakSYS and SPC, enables companies to drive continuous improvement, minimize quality deviations, and deliver unparalleled value to customers and stakeholders alike. If you would like to learn more about how TrakSYS-powered SPC helps optimize quality management, head over to our blog now.
FAQs
Related Blog Posts


Let’s Build Your Plan
We’ll help you create the right configuration—today and for the future.