Unlocking Manufacturing Success: Top 6 KPIs for Monitoring Production Schedule Health with TrakSYS
Staying competitive often hinges on how efficiently production schedules are executed. Delays and disruptions can cause ripples throughout an organization, affecting operational efficiency, customer satisfaction, profitability, and more.
Tracking the right key performance indicators (KPIs) is essential for understanding the health of your production schedule and driving continuous improvement. This is where TrakSYS comes in.
As a robust Manufacturing Execution System (MES), TrakSYS excels at collecting vast amounts of data generated on the shop floor—production count, quality metrics, equipment status, and more. The platform's true power, though, lies in its ability to provide visibility into KPIs, deliver actionable insights, and enable sustained improvements.
Let’s take a look at the top 6 KPIs we see manufacturers utilizing to monitor production schedule health, and how they function within TrakSYS.
On-Time Delivery (OTD)
What it Measures
The percentage of orders delivered on or before their promised date.
Why it Matters
OTD reflects your ability to meet customer commitments, directly impacting customer satisfaction and loyalty. High OTD reflects a healthy supply chain, while dips in OTD can lead to customer dissatisfaction, negative reputation, and loss of revenue.
How TrakSYS Can Help
TrakSYS automatically tracks delivery dates against promise dates using integrated workflows and reporting dashboards. With its Algorithmic Production Scheduling (APS) functionality, TrakSYS can also create schedules prioritized by promise dates, giving the production floor the best opportunity to meet delivery commitments and maintain a consistently high OTD%.
Calculation

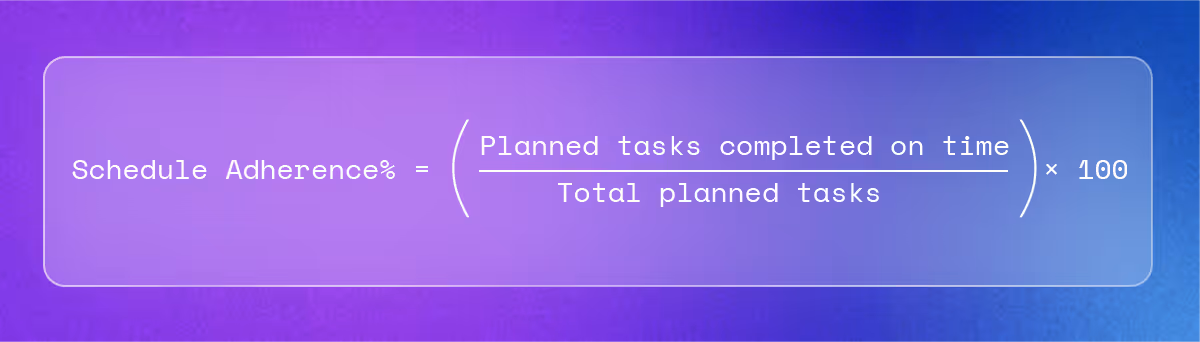
Schedule Adherence
What it Measures
The degree to which production follows the planned schedule.
Why it Matters
Schedule adherence provides insight into how efficiently production schedules are executed, and can lead to a more granular understanding of operational efficiency, resource utilization, workload distribution, and more.
How TrakSYS can Help
TrakSYS uniquely maintains both sides of the equation: the planned schedule from ERP and the actual production events from the shop floor. This gives manufacturers the complete picture needed to calculate adherence accurately. Without capturing the actuals, businesses often struggle to understand the real drivers behind missed schedules.
With TrakSYS, every production event is tracked—start times, stops, changeovers, downtimes, and completions. When adherence dips, teams can drill down into this data to uncover root causes, whether it’s unplanned downtime, supply chain delays, or resource constraints. Instead of just knowing that the schedule slipped, TrakSYS shows you why.
Calculation
Production Cycle Time
What it Measures
The total time required to complete a cycle of production.
Why it Matters
Identifying excessive cycle times can highlight bottlenecks and inefficiencies, while, on the other hand, monitoring efficient cycle times can pinpoint what's working well.
How TrakSYS can Help
TrakSYS measures real-time performance cycle times against historical records to help businesses identify trends (both good and bad), conduct root-cause analysis, and drive continuous improvement.
Calculation

Capacity Utilization (CU)
What it Measures
The percentage of available production capacity being utilized.
Why it Matters
Balancing capacity utilization is important for preventing resource overloads and maximizing production—and financial—efficiency.
How TrakSYS can Help
TrakSYS aggregates machine and labor data to calculate and visualize utilization trends, so users can see how to maximize capacity, output, and profitability. This helps organizations determine where capacity is underutilized or constrained and understand how underperforming lines, unplanned downtime, and supply chain issues affect CU.
Calculation

Order Lead Time
What it Measures
The time from when an order is placed to when it is completed.
Why it Matters
Keeping lead times consistent is critical to providing accurate delivery times, stocking proper inventory, maintaining customer satisfaction, and overall optimization.
How TrakSYS can Help
TrakSYS integrates with ERP systems to streamline end-to-end order tracking and provide real-time visibility into every stage of the order lifecycle. The Visual Workflow engine enables system architects to rapidly recreate living, logic-based workflows within the platform, helping ensure TrakSYS keeps operators up to date on any given order.
Calculation

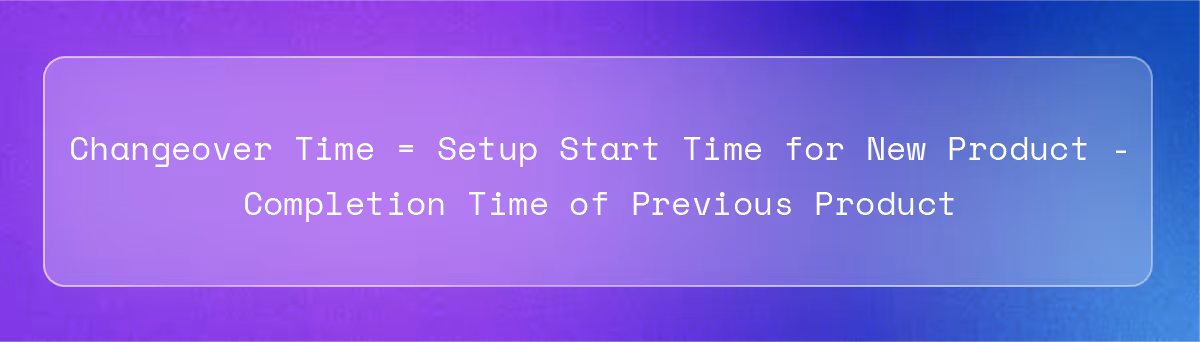
Changeover Time
What it Measures
The time it takes to switch from producing one product to another.
Why it Matters
If not executed properly and intentionally, changeovers have the potential to drive unplanned downtime, push manufacturers toward compliance violations, and derail schedule adherence.
How TrakSYS can Help
From their production dashboards, operators can monitor, stop, or start a changeover. They can also see whether a changeover started on time, whether there are any errors with the process, who initiated the changeover, and the current status—scheduled, live, completed, paused, failed, etc.
Beyond tracking real-time events, TrakSYS also records historical changeover times.
This data can then be fed into future production schedules, helping to create more accurate and realistic production plans. By accounting for true changeover durations, TrakSYS enables manufacturers to minimize schedule risk, improve adherence, and set achievable commitments for upcoming weeks.
Calculation
Conclusion
Maintaining a healthy production schedule isn’t just about staying on time—it’s about safeguarding efficiency, profitability, and customer trust. The six KPIs outlined here (when tracked consistently) offer manufacturers the clarity needed to spot risks early, eliminate bottlenecks, and align resources with demand.
TrakSYS elevates this process by turning raw shop floor data into meaningful insights, empowering teams to not only measure performance but also act on it in real-time. By leveraging the platform’s powerful dashboards, workflows, and integration capabilities, manufacturers can move beyond reactive problem-solving to proactive, strategic decision-making.
If you’re ready to strengthen your production schedule health, reduce uncertainty, and unlock new opportunities for growth, TrakSYS provides the visibility, knowledge, and control to get you there. Contact us today to get started.
FAQs
Related Blog Posts


Let’s Build Your Plan
We’ll help you create the right configuration—today and for the future.